Water
Water Access Analysis
Capstone Project - Data Science Diploma
Welcome! In here you will find details about my data science project. I will show you how I got started with the data analysis, and how I implemented machine learning.
Overview
Water is becoming scarce in many communities across Canada. The current situation warrants a detailed analysis of the available data
Problem statement: pollutants present on river basins across Canada are affecting drinking water supplies and our food security
Opportunity: the right machine learning solution could help mitigate adverse effects.
Vision
Using machine learning, we could predict the long term effects of different chemicals polluting our water supply
By targeting different affected sectors, business stakeholders will learn about potential opportunities
And, as more models are trained and new solutions are created, more individuals could benefit
Data Dictionary
|
Variable |
Column Name |
Description |
|
SAMPLE DATE AND TIME |
DATE_TIME_HEURE |
SAMPLE DATE AND TIME IN DD/MM/YYYY HH:MM FORMAT USING LOCAL TIME ZONE |
|
DATUM |
DATUM |
DATUM USED FOR LATITUDE AND LONGITUDE |
|
MEASUREMENT FLAG |
FLAG_MARQUEUR |
FLAG APPLICABLE TO MEASUREMENT VALUE (<-LESS THAN, T-TRACE VALUE REPORTED BELOW DETECTION LIMIT BY LABORATORY) |
|
LATITUDE |
LATITUDE |
LATITUDE IN DECIMAL DEGREES FOR THE NOTED DATUM |
|
LONGITUDE |
LONGITUDE |
LONGITUDE IN DECIMAL DEGREES FOR THE NOTED DATUM |
|
METHOD DETECTION LIMIT |
MDL_LDM |
METHOD DETECTION LIMIT REPORTED BY THE LABORATORY FOR THE NOTED METHOD |
|
METHOD CODE |
METHOD_CODE |
NUMERIC ANALYTICAL METHOD CODE FROM THE NATIONAL VMV DICTIONARY |
|
SHORT METHOD TITLE |
METHOD_TITLE |
SHORT METHOD TITLE FROM THE NATIONAL VMV DICTIONARY. FULL METHOD DESCRIPTIONS AVAILABLE UPON REQUEST AT EC.MSQEINFORMATION-WQMSINFORMATION.EC@CANADA.CA |
|
OCEAN DRAINAGE AREA |
OCEANDA |
OCEAN DRAINAGE AREA THAT MONITORING SITE IS LOCATED IN |
|
PEARSE DRAINAGE AREA |
PEARSEDA |
PEARSE DRAINAGE AREA THAT MONITORING SITE IS LOCATED IN |
|
PROVINCE/TERRITORY |
PROV_TERR |
PROVINCE OR TERRITORY THAT MONITORING SITE IS LOCATED IN |
|
SAMPLE IDENTIFIER |
SAMPLE_ID_ÉCHANTILLON |
UNIQUE SAMPLE IDENTIFIER FROM MONITORING PROGRAM |
|
SAMPLE DETECTION LIMIT |
SDL_LDE |
SAMPLE DETECTION LIMIT REPORTED BY THE LABORATORY FOR THE SPECIFIC ANALYIS OF THE REPORTED MEASUREMENT. ELEVATED SAMPLE DETECTION LIMIT ABOVE METHOD DETECTION LIMITS MAY INDICATE DILUTION, MATRIX INTERFERENCE OR OTHER ISSUES WITH THE SPECIFIC ANALYSIS. |
|
SITE DESCRIPTION |
SITE_DESC |
SITE DESCRIPTION THAT MAY INCLUDE SPECIFIC SAMPLING LOCATION, RATIONALE FOR MONITORING LOCATION (E.G. REFERENCE, UPSTREAM/DOWNSTREAM, ETC.), AND LOCAL LAND-USE INFORMATION. |
|
SITE NAME |
SITE_NAME |
FULL SITE NAME FROM MONITORING PROGRAM |
|
SITE NUMBER |
SITE_NO |
UNIQUE SITE NUMBER/IDENTIFICATION FROM MONITORING PROGRAM |
|
SITE TYPE |
SITE_TYPE |
SAMPLE SITE TYPE (E.G. RIVER, LAKE, ETC.) |
|
VALIDATION STATUS |
STATUS_STATUT |
LEVEL OF VALIDATION (P-PROVISIONAL, V-VALIDATED) |
|
UNIT NAME |
UNIT_NAME |
FULL MEASUREMENT UNIT NAME FROM NATIONAL VMV DICTIONARY |
|
UNIT |
UNIT_UNITÉ |
MEASUREMENT UNIT ABBREVIATION FROM NATIONAL VMV DICTIONARY |
|
MEASUREMENT VALUE |
VALUE_VALEUR |
MEASUREMENT VALUE OR CONCENTRATION |
|
VARIABLE NAME |
VARIABLE |
VARIABLE NAME FROM NATIONAL VMV DICTIONARY |
|
VARIABLE CODE |
VARIABLE_CODE |
NUMERIC VARIABLE CODE FROM NATIONAL VMV DICTIONARY |
|
VARIABLE TYPE |
VARIABLE_TYPE |
VARIABLE TYPE FROM NATIONAL VMV DICTIONARY |
|
VMV CODE |
VMV_CODE |
NUMERIC VALID METHOD VARIABLE (VMV) CODE FROM NATIONAL VMV DICTIONARY |
Project Workflow
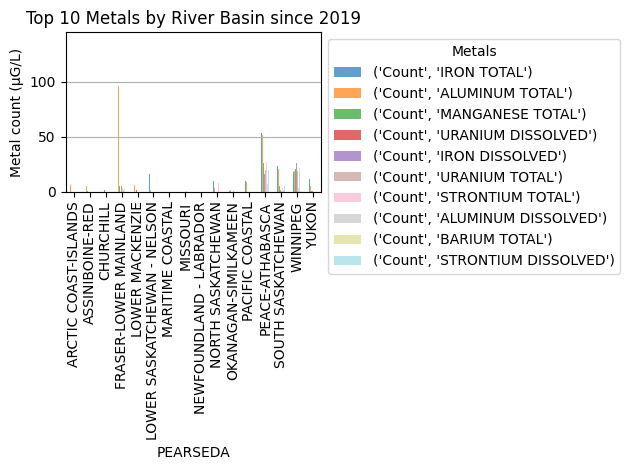
Exploratory Data Analysis
We acquired data from the Government of Canada. We proceeded to clean and generate preliminary visualizations. This is a rather large dataset of multiple samplings accross Canada, spanning over 2 decades. We found the database to be intricate amd hard to work with.
Preprocessing
As we continued to analyze the data, we derived insights, and selected a baseline model. We also applied Feature Engineering.
Advanced Modelling
Given that our data is continuous and categorical, we chose regressors Models, including: Linear Regression, Random Forest Regressor, AdaBoost, Gradient Booster Regressor, and XGBoost.
Models Comparisons
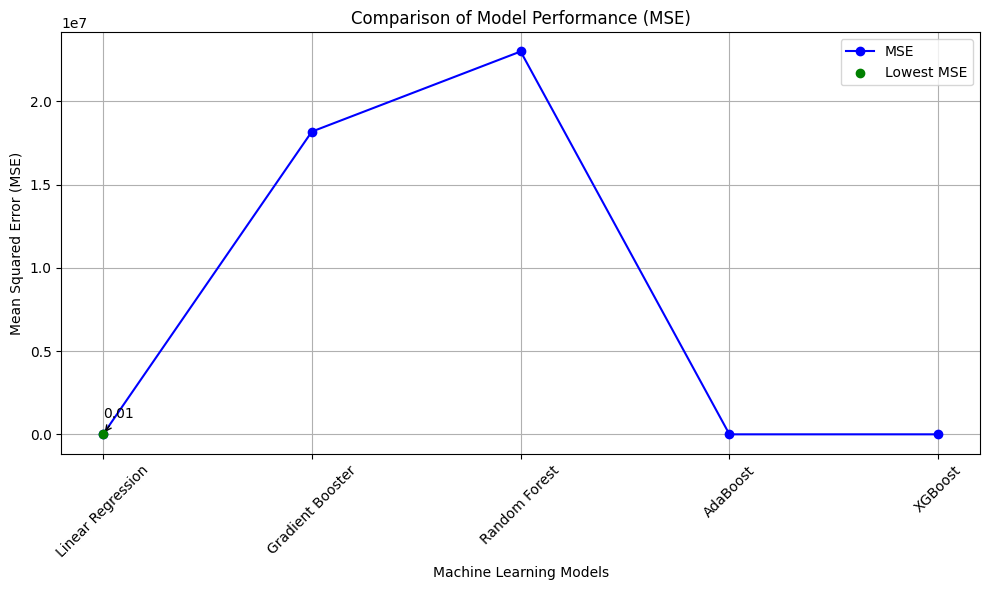 Although Linear Regression gave us excellent model performance, this model has a low AUROC score (Measure of prediction power) and low score in Training Time. Gradient Booster Regressor, on the other hand gave us poor model fit. For that reason, we opted to fine tuned the other three models, by experimenting with different hyperparameters.
Conclusion and Call to Action
This data analysis provides valuable insights into water quality across diverse Canadian river basins, encompassing extensive geographical regions and multiple pollutant variables with varying units of measurement. Despite the intricacies of the dataset, including its large size and heterogeneous nature, our analysis successfully navigated these challenges through meticulous cleaning processes, which involved dropping irrelevant columns and employing feature engineering techniques such as hot encoding. Through the application of various regression models, we were able to assess and compare their predictive capabilities, shedding light on the effectiveness of each model in forecasting water quality parameters.